Anthropic Annualized Revenue Run-Rate
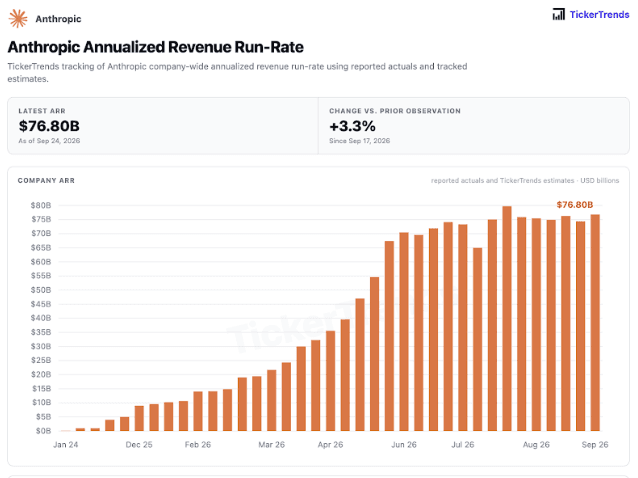
Your honor, those four months were only a week when I plotted them.
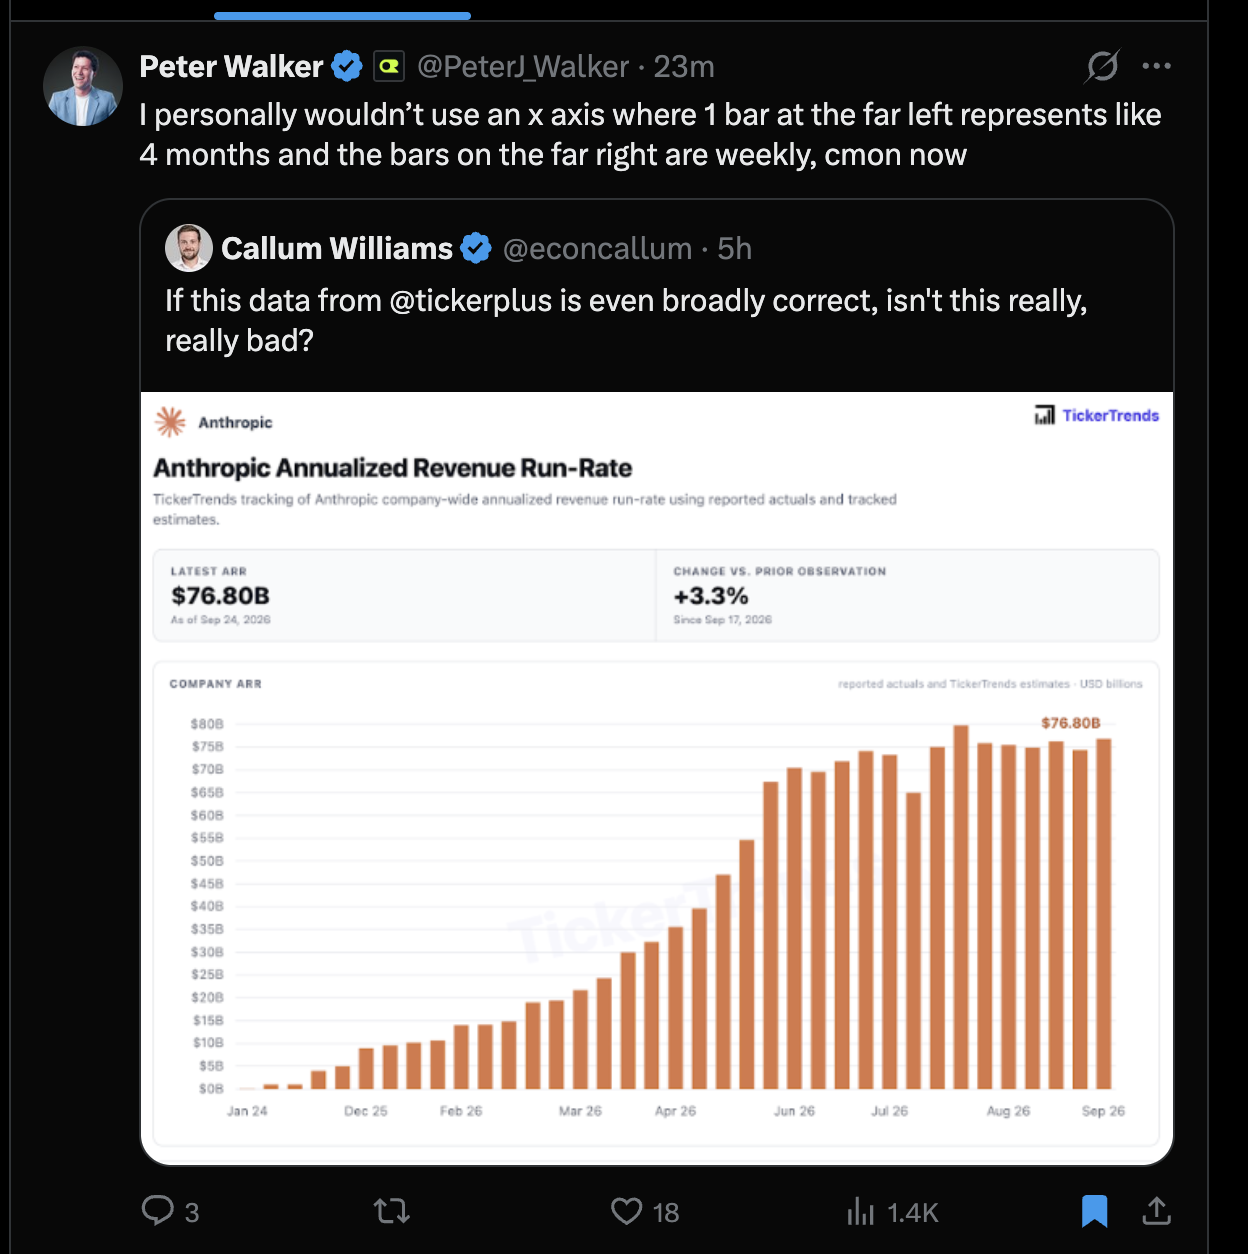
The chart gives equally spaced bars to observations separated by unequal amounts of time. Look at the labels: January 2024 to December 2025 takes up roughly as much horizontal space as some later spans of just a few months. The calendar speeds up and slows down while the bars march along at the same pace.
That compresses the earlier history and stretches the recent observations. The shape invites you to read growth speed and plateau duration from horizontal distance, but that distance no longer represents elapsed time consistently.
Peter Walker (@PeterJ_Walker) called out the changing intervals in the screenshot below. Equal spacing can work for comparing individual observations, but a revenue history needs dates positioned proportionally. A line chart with a dot at each actual observation date would make the trend easier to judge.
The recent plateau could still be real. This exhibit concerns the time axis; it does not verify the reported revenue figures or TickerTrends' estimates.
Source context: the supplied screenshot shows Walker responding to Callum Williams' post (@econcallum), which references @tickerplus. The chart itself is branded TickerTrends and dated September 24, 2026.