MoCC
Museum of Chart Crimes (MoCC) is a collaborative hall of fame for incredible graphs on the Internet.Share your favorites to expand the collection.
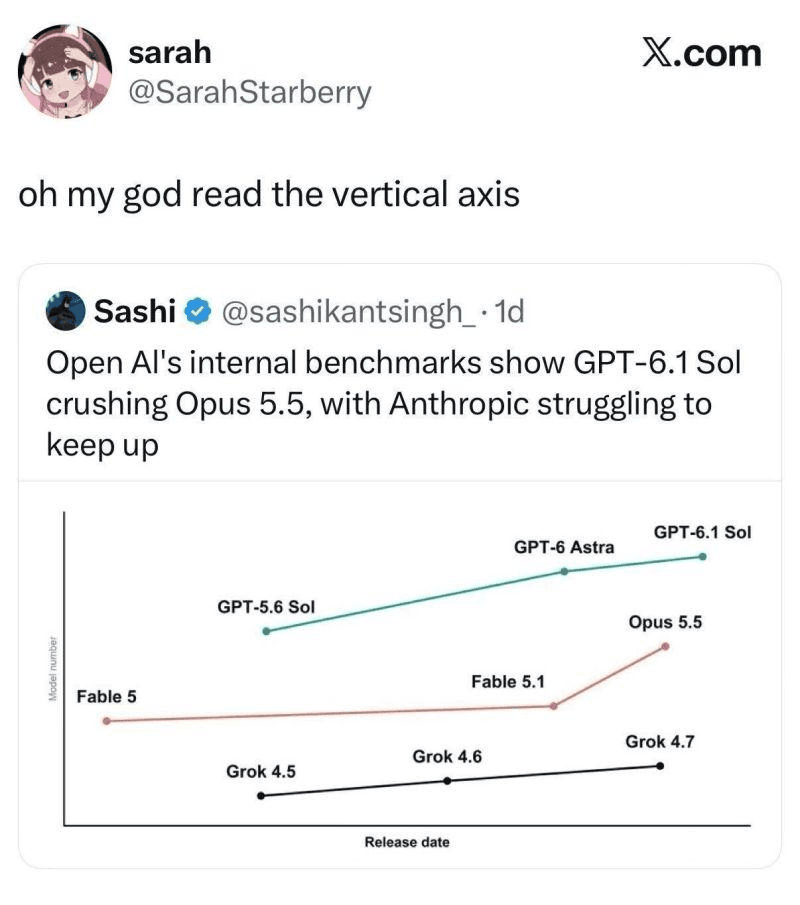
Model Number vs. Release Date
Curated by sarah
GPT-6.1 beats Opus 5.5 at having a bigger version number.
Graph by Sashi
More Exhibits
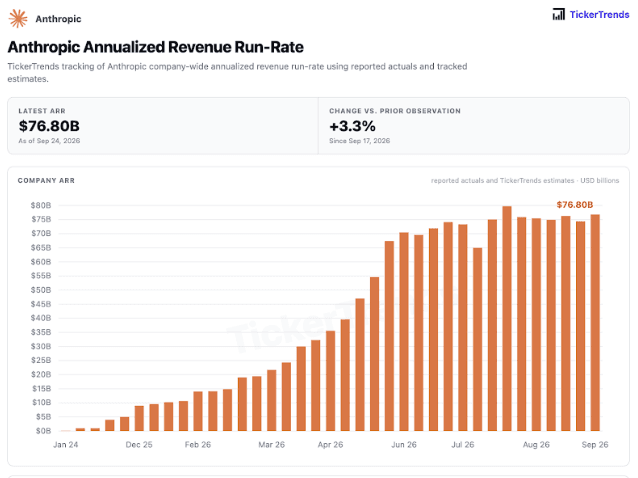
Anthropic Annualized Revenue Run-Rate
Curated by Peter Walker
Your honor, those four months were only a week when I plotted them.
Graph by TickerTrends
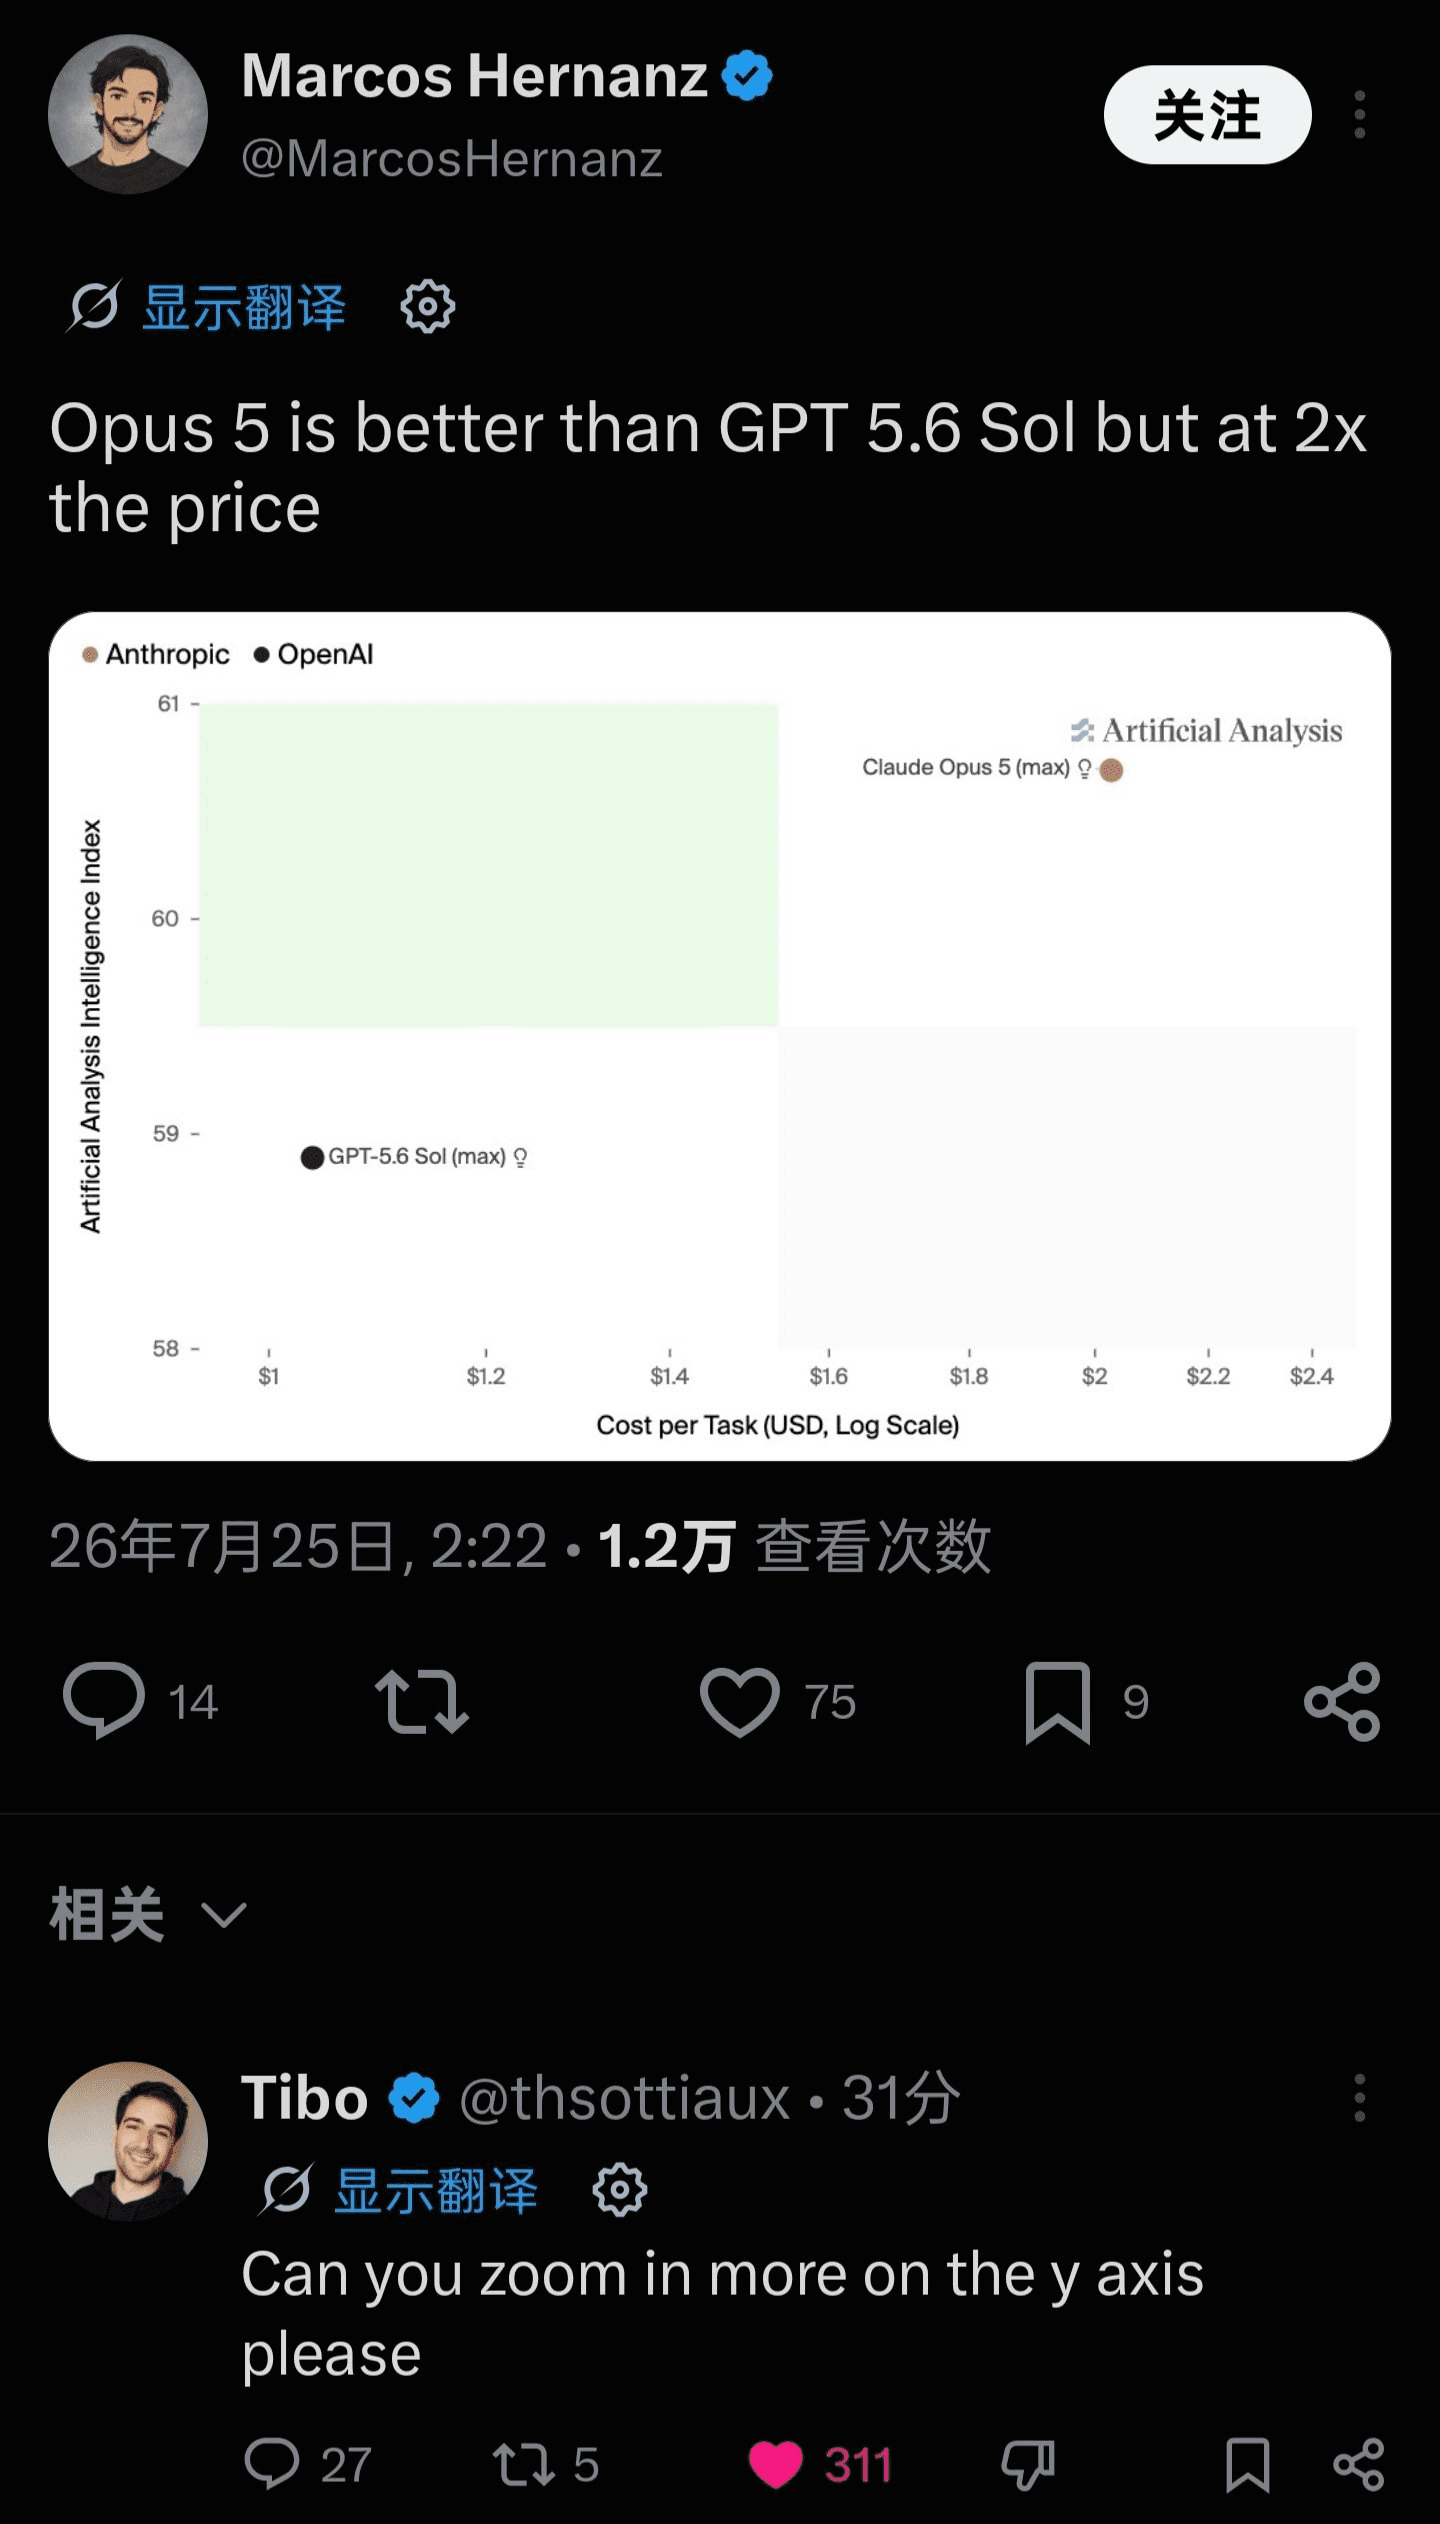
Claude Opus 5 vs. GPT-5.6 Sol
Curated by Tibo
Can you zoom in more on the y-axis, please?
Graph by Marcos Hernanz, Artificial Analysis
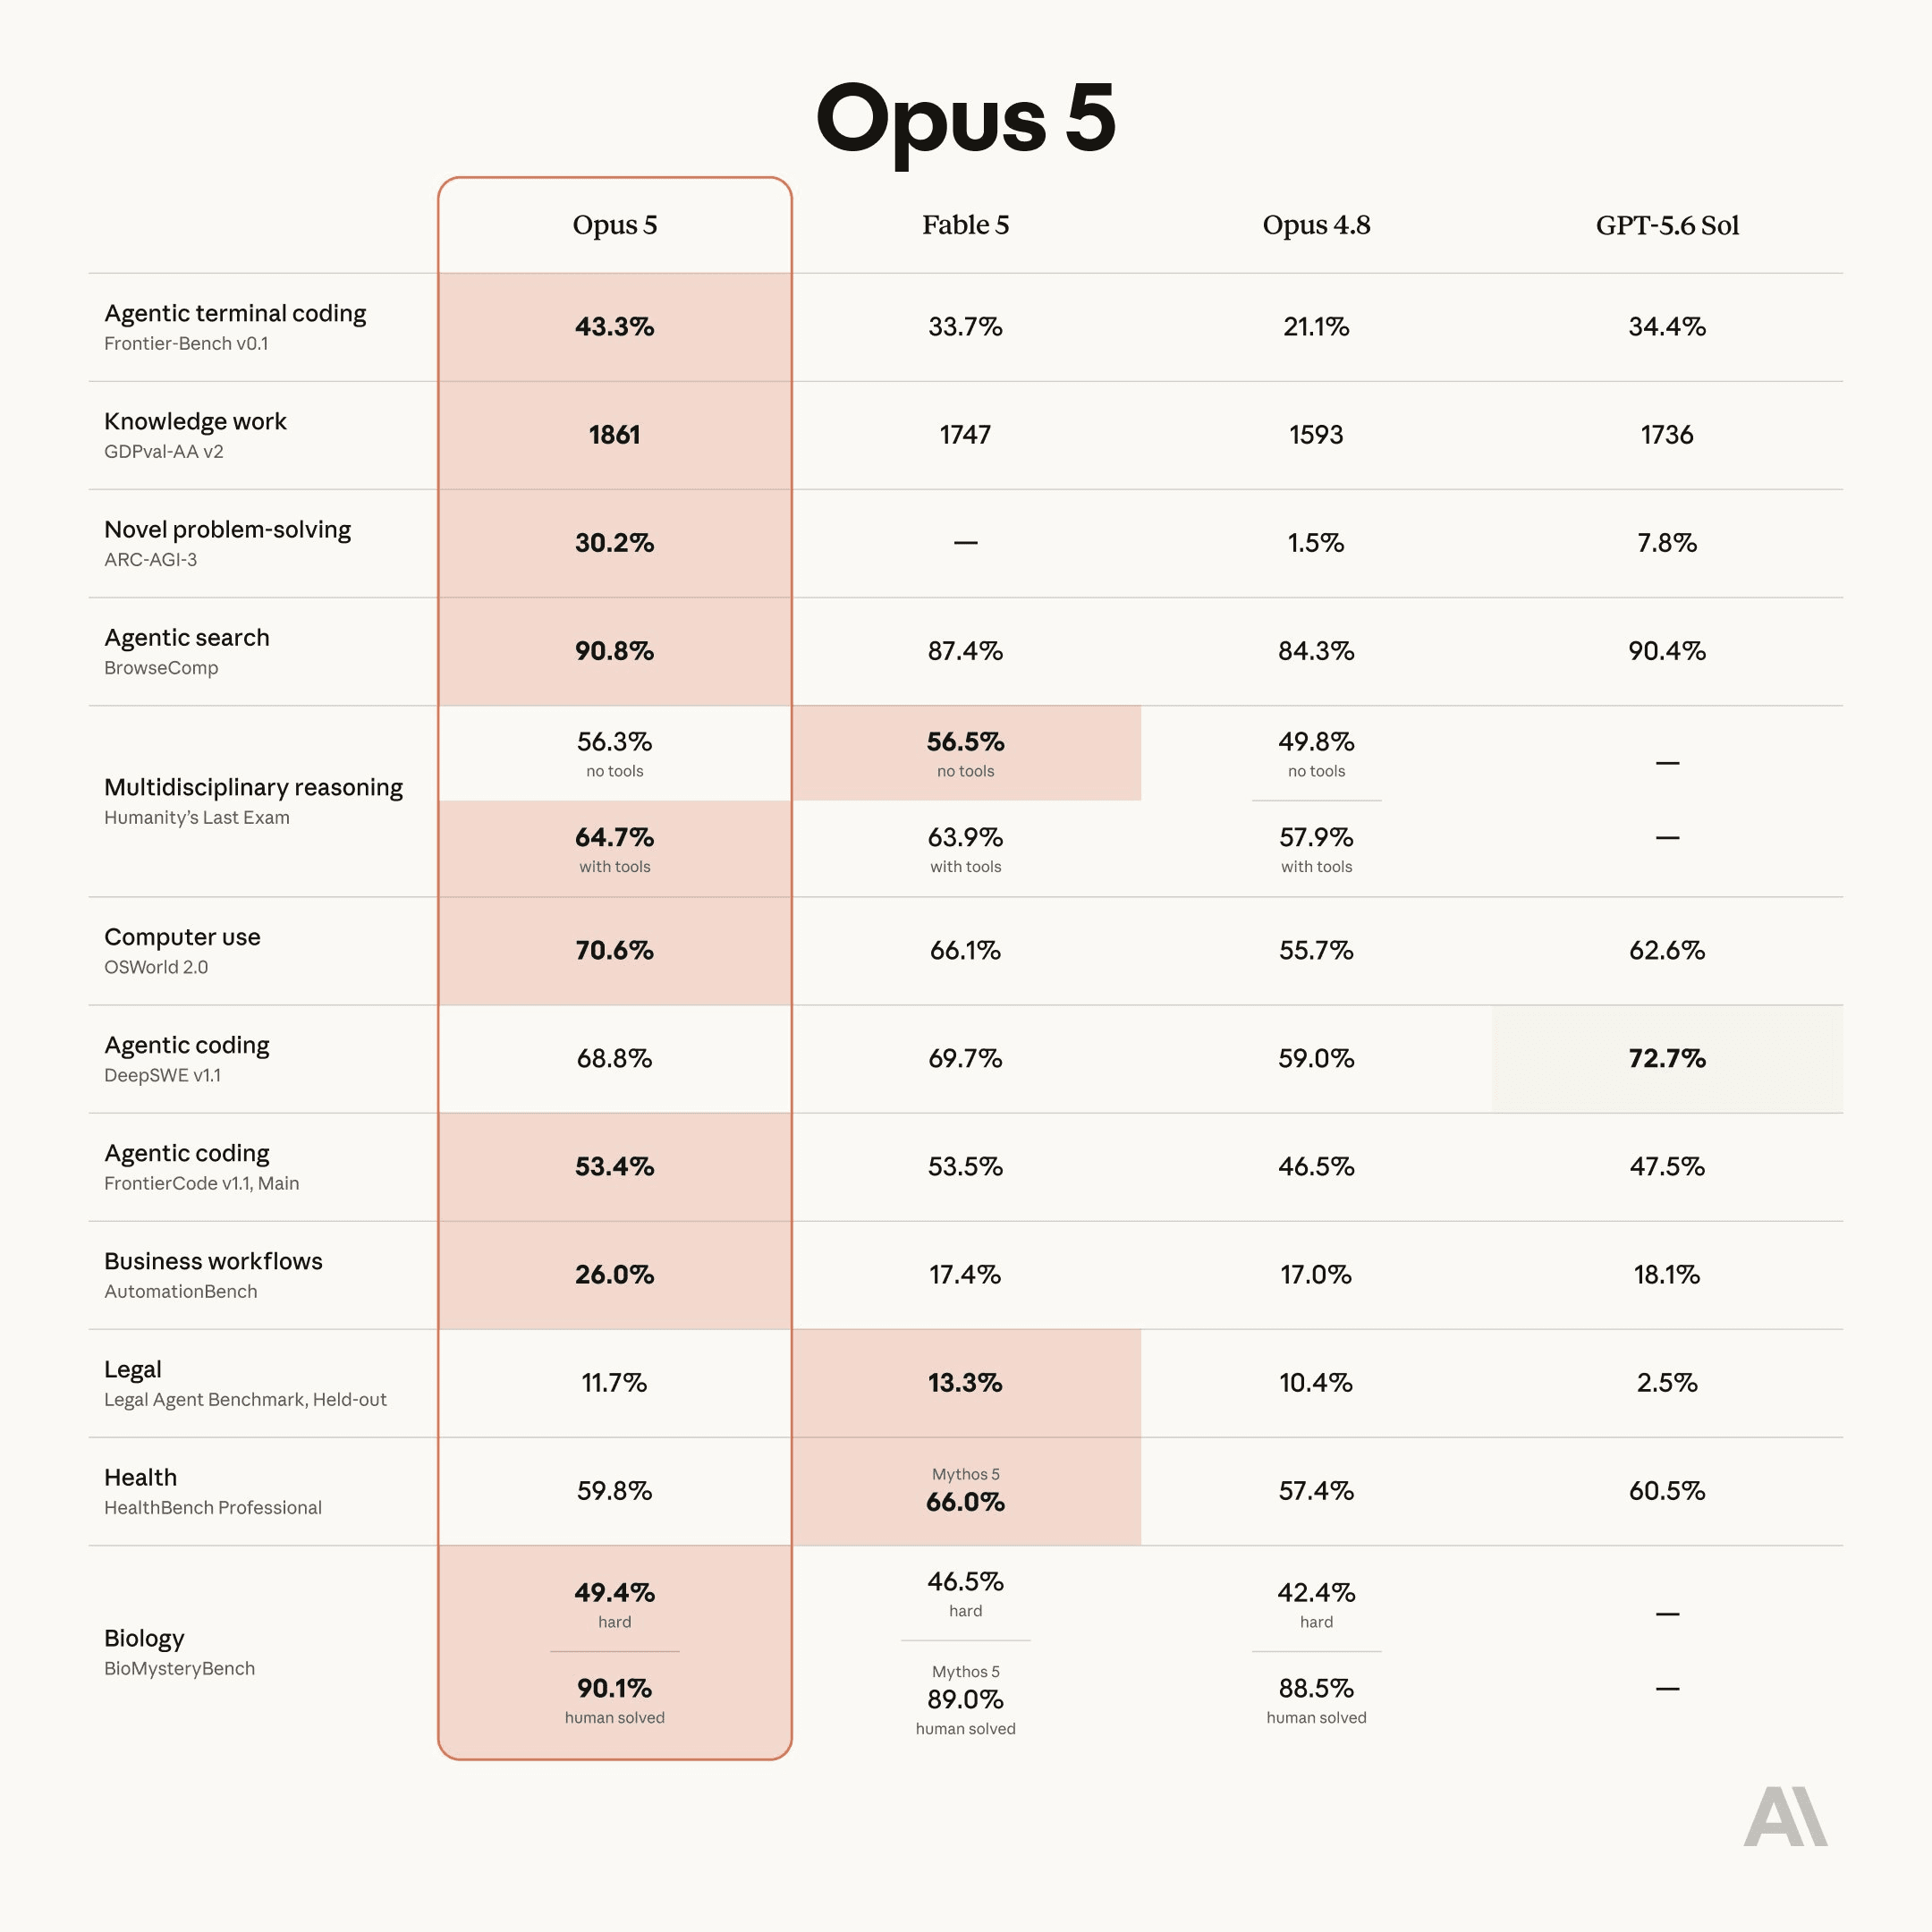
Claude Opus 5 Benchmark Comparison
Curated by @kimmonismus
53.4% got the winner's highlight; 53.5% did not.
Graph by Anthropic

Meta Muse Spark Release Graph
Curated by Nathan Spencer
Meta highlighted Muse Spark instead of the chart leader.
Graph by Meta

U.S. Steel Production Increases
Curated by Jeff Dean
A 1% difference made to look enormous.
Graph by The White House


Exponential Growth in AI
Curated by Arctic Byte
Scale and units are optional when you have AI.
Graph by Haider.

Exhibit 3 - Share Mix - AI Agent vs. Traditional Search Instance
Curated by Xiao Ma
The charm of dual y-axes.
Graph by Wells Fargo

GPT-5 on SWE-Bench Verified
Curated by Xiao Ma
52.8 is higher than 69.1 which is the same height as 30.8.
Graph by OpenAI