Claude Opus 5 vs. GPT-5.6 Sol
Graph by Marcos Hernanz, Artificial Analysis
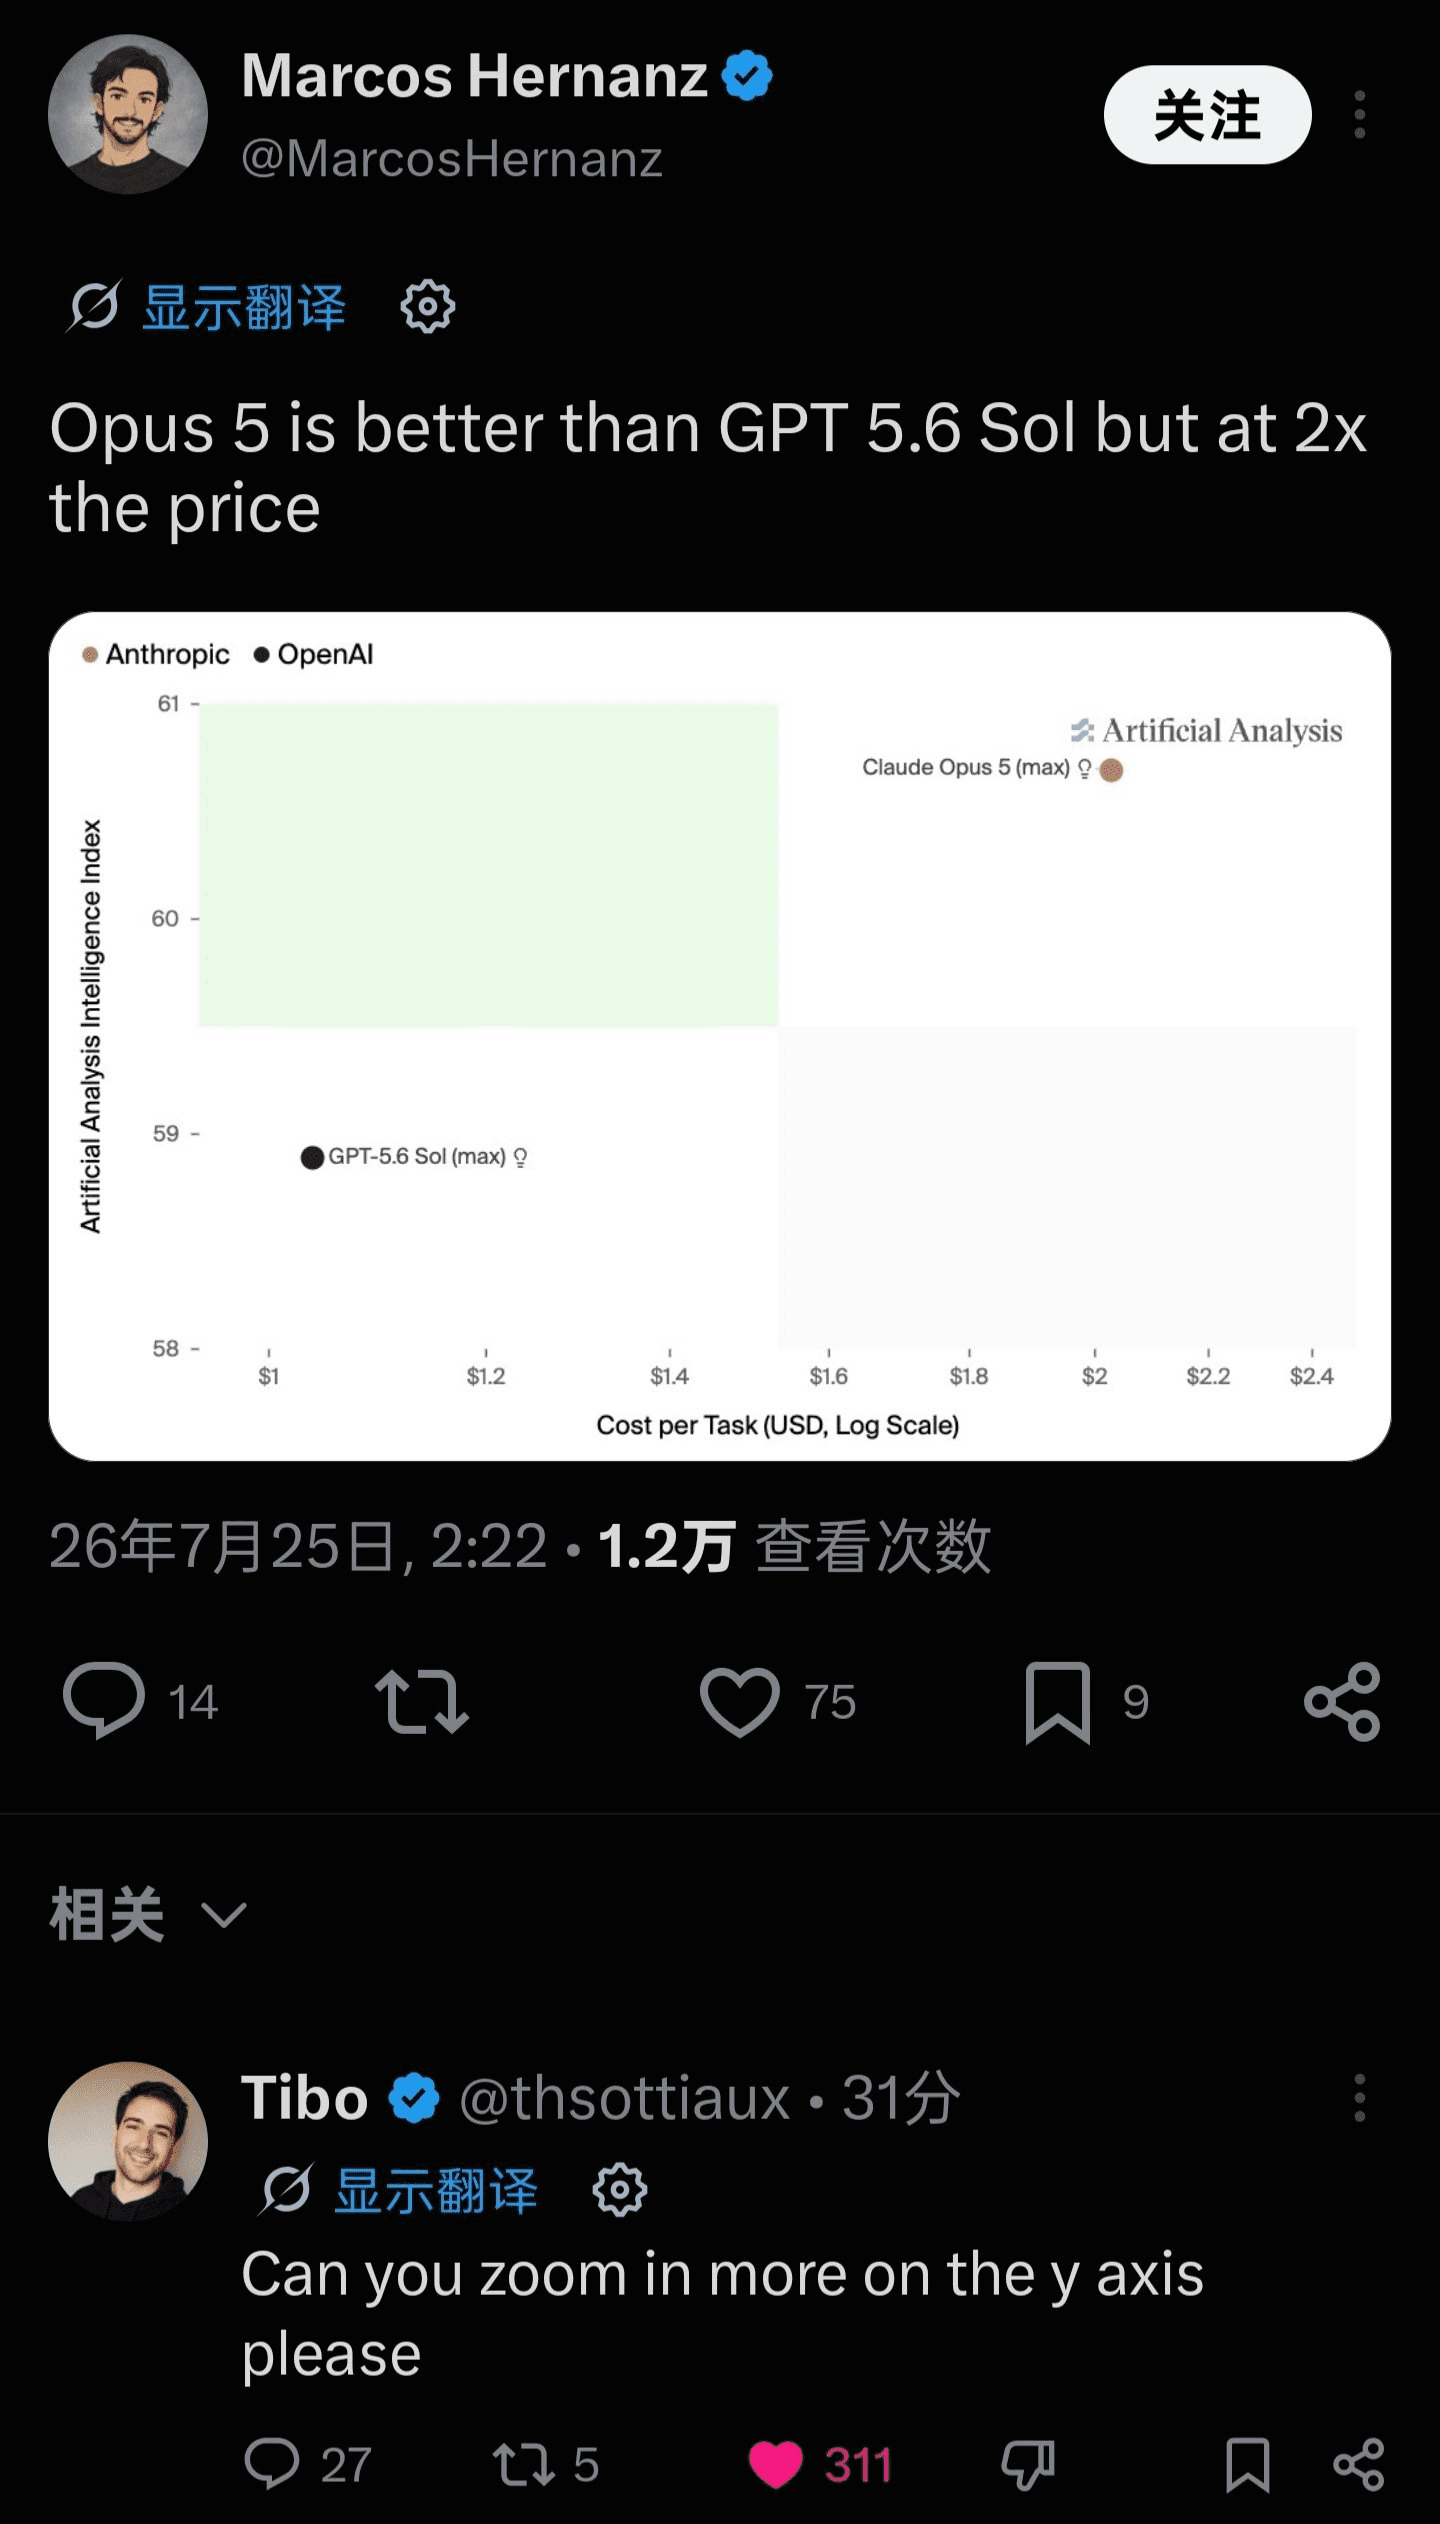
Graph by Marcos Hernanz, Artificial Analysis
Curated by Tibo
Tibo (@thsottiaux) called it out:
“Can you zoom in more on the y axis please”
The chart compares Claude Opus 5 and GPT-5.6 Sol on the Artificial Analysis Intelligence Index, but its y-axis covers only 58 to 61. That narrow range makes a difference of less than two points look much larger than it is.
Starting the y-axis at zero would put the gap in proportion to the full scale of the metric.
The original post by Marcos Hernanz has since been deleted. The screenshot preserves the post together with Tibo's reply.